Gold's Shooting Star Pattern Signals Potential Market Shift Amid Record Rally

Video section is only available for
PREMIUM MEMBERS
In a week marked by contrasting price action, gold futures in the April contract closed modestly higher, gaining $7.60 to reach $2,893.70 per troy ounce. However, Friday's session revealed significant bearish sentiment as prices plummeted $63.50 from the day's opening of $2,957.30, after touching an intraday high of $2,964.10.
The U.S. dollar continued its downward trajectory, declining 0.26% on Friday and recording a substantial weekly loss of 1.19%. The dollar index fell to 106.685, marking its lowest level since mid-December. Despite this dollar weakness, which typically supports gold prices, other market forces dominated precious metals trading.
According to Reuters, global stock indices reached new heights while U.S. Treasury yields retreated. This market movement reflected investor response to softer U.S. economic data and recent tariff announcements, fueling expectations for more aggressive Federal Reserve rate cuts.
January's economic indicators presented mixed signals for market participants. The Producer Price Index showed a 0.4% increase, while the Consumer Price Index rose by 0.5%, exceeding both December's 0.4% gain and the consensus forecast of 0.3%. These inflation reports, combined with President Trump's revised approach to tariffs, significantly influenced market sentiment across various asset classes.
The administration's decision to conduct preliminary studies through agency heads before implementing reciprocal tariffs marked a crucial shift in market dynamics. Pepperstone analyst Quasar Elizundia noted that this measured approach "eased initial market jitters and led to a weaker dollar, as fears of an escalating trade war subsided."
There are also technical patterns that strengthen that idea that the events this week have signaled a potential market top in gold. Market participants should carefully monitor price action in the coming weeks. While past patterns don't guarantee future performance, the confluence of these technical indicators suggests increased potential for a price correction.
Technical Analysis Reveals a Shooting Star and a Longer-Term Pattern
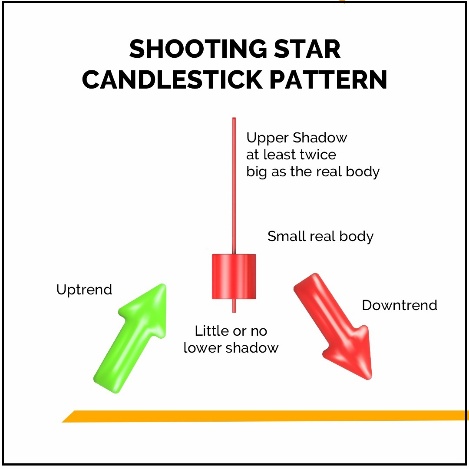
Looking at a weekly Japanese candlestick chart of gold today’s candle can be identified as a shooting star. This pattern can be an excellent indication of a major shift in market sentiment from bullish to bearish. A single Japanese candlestick formed that is identified as a shooting star and is viewed as a reversal pattern that forms after a defined uptrend.
It has a small "Real Body" with a long upper shadow or wick, and little or no lower shadow indicating a potential trend reversal because of the strong selling pressure that occurred during the highs of the trading session.
The shooting star was the last candle in a much larger pattern composed of seven consecutive weekly bullish candles. Friday’s candle told a much different short-term picture because the long red candle created a simple two session pattern called and engulfing bearish.
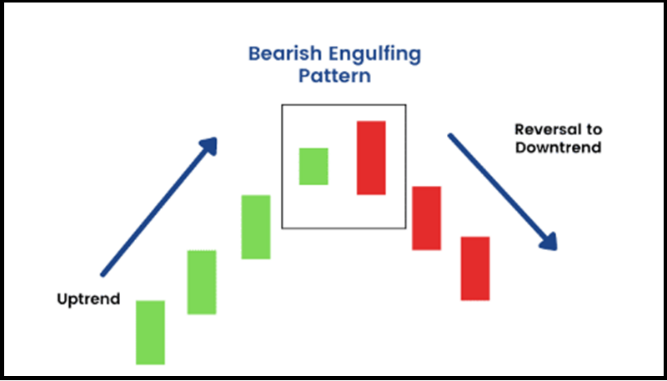
A fairly common pattern in Japanese candlestick charts is labeled as an “Engulfing Bearish”, and was seen
in a daily Japanese candlestick chart of gold.
The engulfing bearish pattern can signal a major price reversal from bullish to bearish after defined upward trend. The pattern is composed of two candlesticks beginning with a bullish candlestick (drawn in green or white) in an uptrend, which is followed by a larger bearish candle (drawn in red or black) which opens at or above the prior candle and closes the real body of the prior candle. This pattern is considered to be a strong indicator revealing that the prior upward momentum is waning, and a reversal is on the horizon.
Editor's Note: On today's member page we will add an interview that was recorded earlier this week, with Gary Bohm of Metals and Minors
Wishing you, as always good trading,

Gary S. Wagner - Executive Producer