Support/Resistance Levels Emerge as Gold Rebounds

Video section is only available for
PREMIUM MEMBERS
Gold demonstrated resilience this week, recovering from recent losses to post a $175 gain—a 3.63% increase—bringing prices to just below the psychologically significant $5,000 threshold. Despite this recovery, the yellow metal remains approximately $660, or 11.82%, below the record high established last week.
While Friday's session saw gold unable to reclaim the $5,000 level, the week's price action established well-defined support and resistance zones that appear poised to govern near-term trading ranges. A comprehensive technical examination of the daily candlestick chart provides insight into probable price trajectories in the coming period.
The Ichimoku Cloud indicator, a comprehensive technical tool offering "one glance" equilibrium analysis, reveals a telling characteristic: the cloud has maintained its bullish green coloration throughout the entire twelve-month period displayed on the chart. This persistent green formation confirms what market participants already understand—gold continues to experience a robust multi-year uptrend. More significantly, recent price corrections, including last Friday's dramatic $235 decline representing a 4.79% drawdown, have not compromised the technical structure of the chart.
Early in the week, gold tested its lowest level since January 5th, reaching an intraday low of $4,402 before value-seeking traders stepped in to support prices. Notably, even during this weakness, pricing remained above the cloud formation—a relationship that has persisted for more than a year. This continued respect for the cloud support suggests that gold has not entered a reversal phase, and the substantial, rather than tenuous, nature of the cloud reinforces the metal's constructive technical posture.
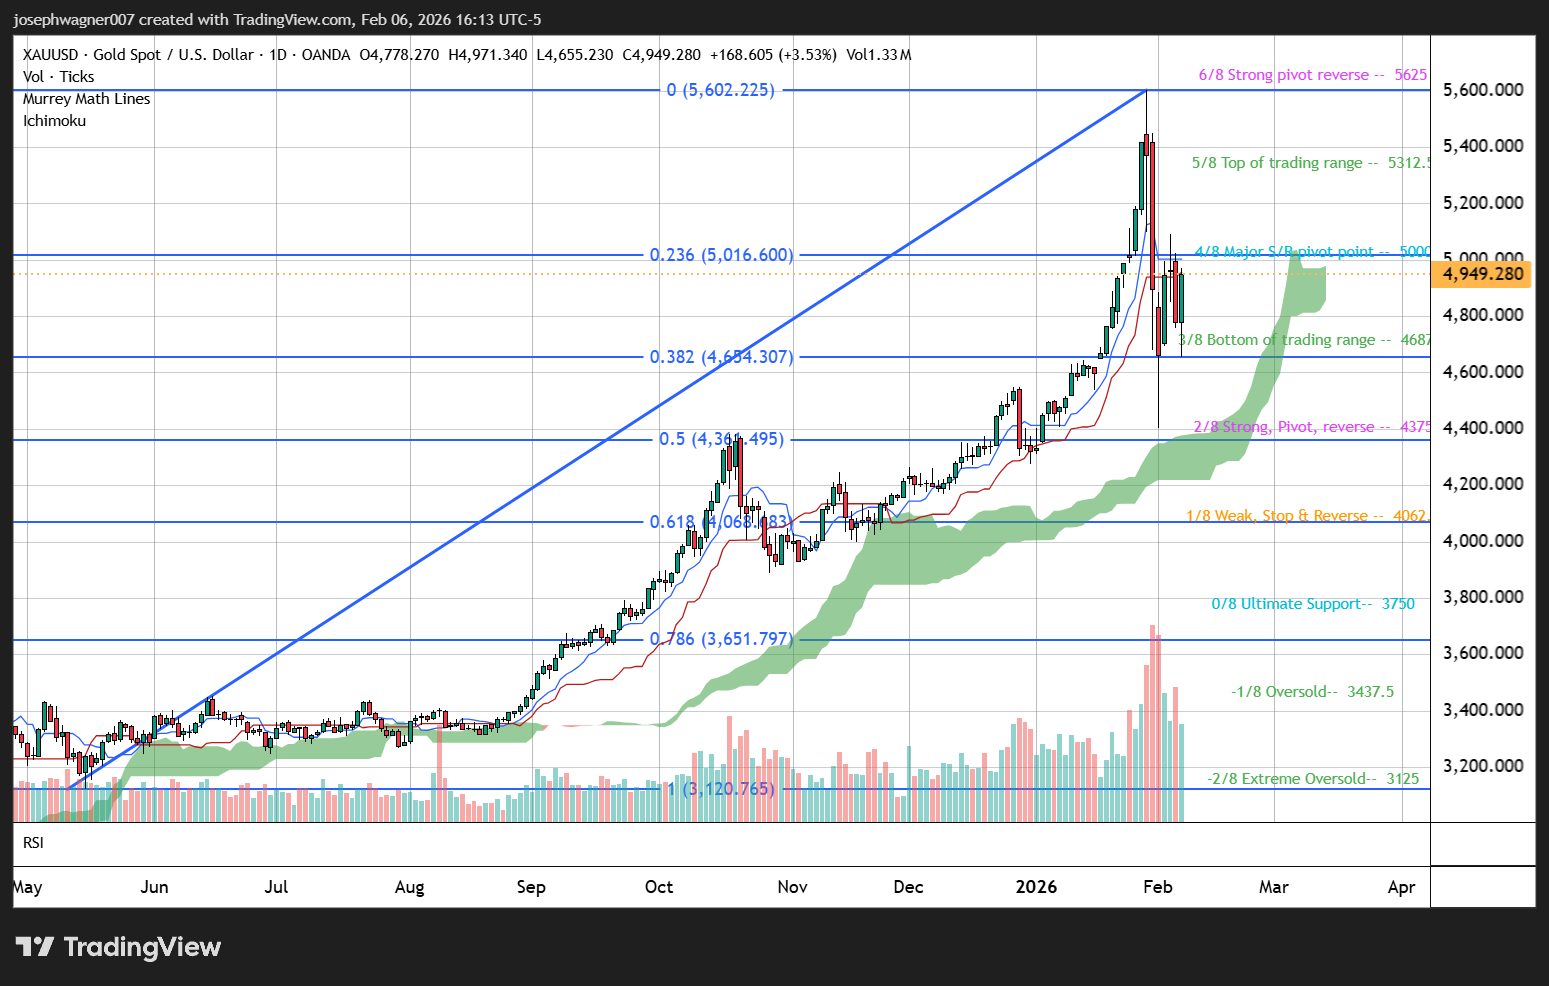
The chart incorporates Murrey Math Lines, a sophisticated analytical framework consisting of eight multicolored horizontal levels. These lines represent support and resistance zones calculated by dividing a price range into eight equal segments, a methodology derived from the work of T.J. Murrey and William Gann. Traders employ these levels to anticipate potential price reversals and identify critical trading zones. The framework designates lines from 0/8 to 8/8, with the 4/8 line serving as the central pivot point, enabling market participants to identify optimal entry and exit positions. Specific lines indicate varying degrees of support strength, resistance, or potential reversal zones, while additional outer lines signal overbought or oversold market conditions.
The convergence of certain Murrey Math Lines with specific Fibonacci retracement levels enhances their analytical significance, particularly the 4/8 line designated as the major support and resistance pivot point. This critical level coincides precisely with $5,000 and aligns with the 23.6% Fibonacci retracement level, creating the first significant area of overhead resistance.
Superimposed on the chart is a Fibonacci retracement analysis spanning from the recent peak of $5,602 down to $3,120. Last Monday's extreme intraday low approached, but did not quite reach, the 50% retracement level. Subsequently, gold advanced above this threshold, ultimately closing above it on February 5th. Since that recovery, prices have not seriously challenged the 50% retracement, and today's intraday low reconfirmed that current support resides at the 38.2% Fibonacci retracement level of $4,654.
A final critical observation concerns the pronounced volatility in trading volume. Although open interest in spot gold has moderated somewhat from last week's elevated levels, it remains substantially above historical norms. This heightened level of market participation underscores an unprecedented phenomenon: gold is currently commanding a degree of attention from market participants that exceeds any previous period in its trading history, reflecting both its price trajectory and its evolving role in global investment portfolios.
The convergence of multiple technical indicators at key price levels suggests that gold's near-term trading range is now well-established, with support firmly anchored near $4,654 and initial resistance at the $5,000 threshold.
Wishing you as always good trading,

Gary S. Wagner - Executive Producer